The Challenge
February 2020: The invisible wall
In February 2020, traditional indicators (RSI, Moving Averages) showed a healthy bull market. Prices were still near all-time highs. Even our LSRI V3 was at Level 1 (Normal) — the ratio-based signal saw no reason to alert.
For an investor, the difference between Feb 3 and Feb 27 is everything:
- Feb 3: A calm, deliberate exit — liquidity still available, no panic
- Feb 27: The first -10% drawdown — a market with no liquidity, forced selling
Our model "bought" 24 days of safety. That's the gap between a reasoned decision and a liquidity trap.
The Discovery
What F_B saw on February 3rd
On February 3rd, 2020, our Head-Dominance Potential ($F_B$) detected a structural rupture. While prices looked stable, the "Liquidity Reports" showed an irreversible asymmetry. The system was Algebraically Locked — $F_B$ dominated $S_{\text{tail}}$, meaning the structure of flows had already committed to a path from which a "return to normal" was mathematically excluded.
Once structural dominance is established, the point of no return is mathematically excluded. In finance, once $F_B$ detected this lock on Feb 3, the market took 3 weeks to catch up with the math.
The Result
The Structural Advantage: 24 days
| LSRI V4 Signal | Level 3 (Critical) on Feb 03 |
| Market Reality | First -10% drawdown on Feb 27 |
| The Structural Advantage | 24 days of early warning |
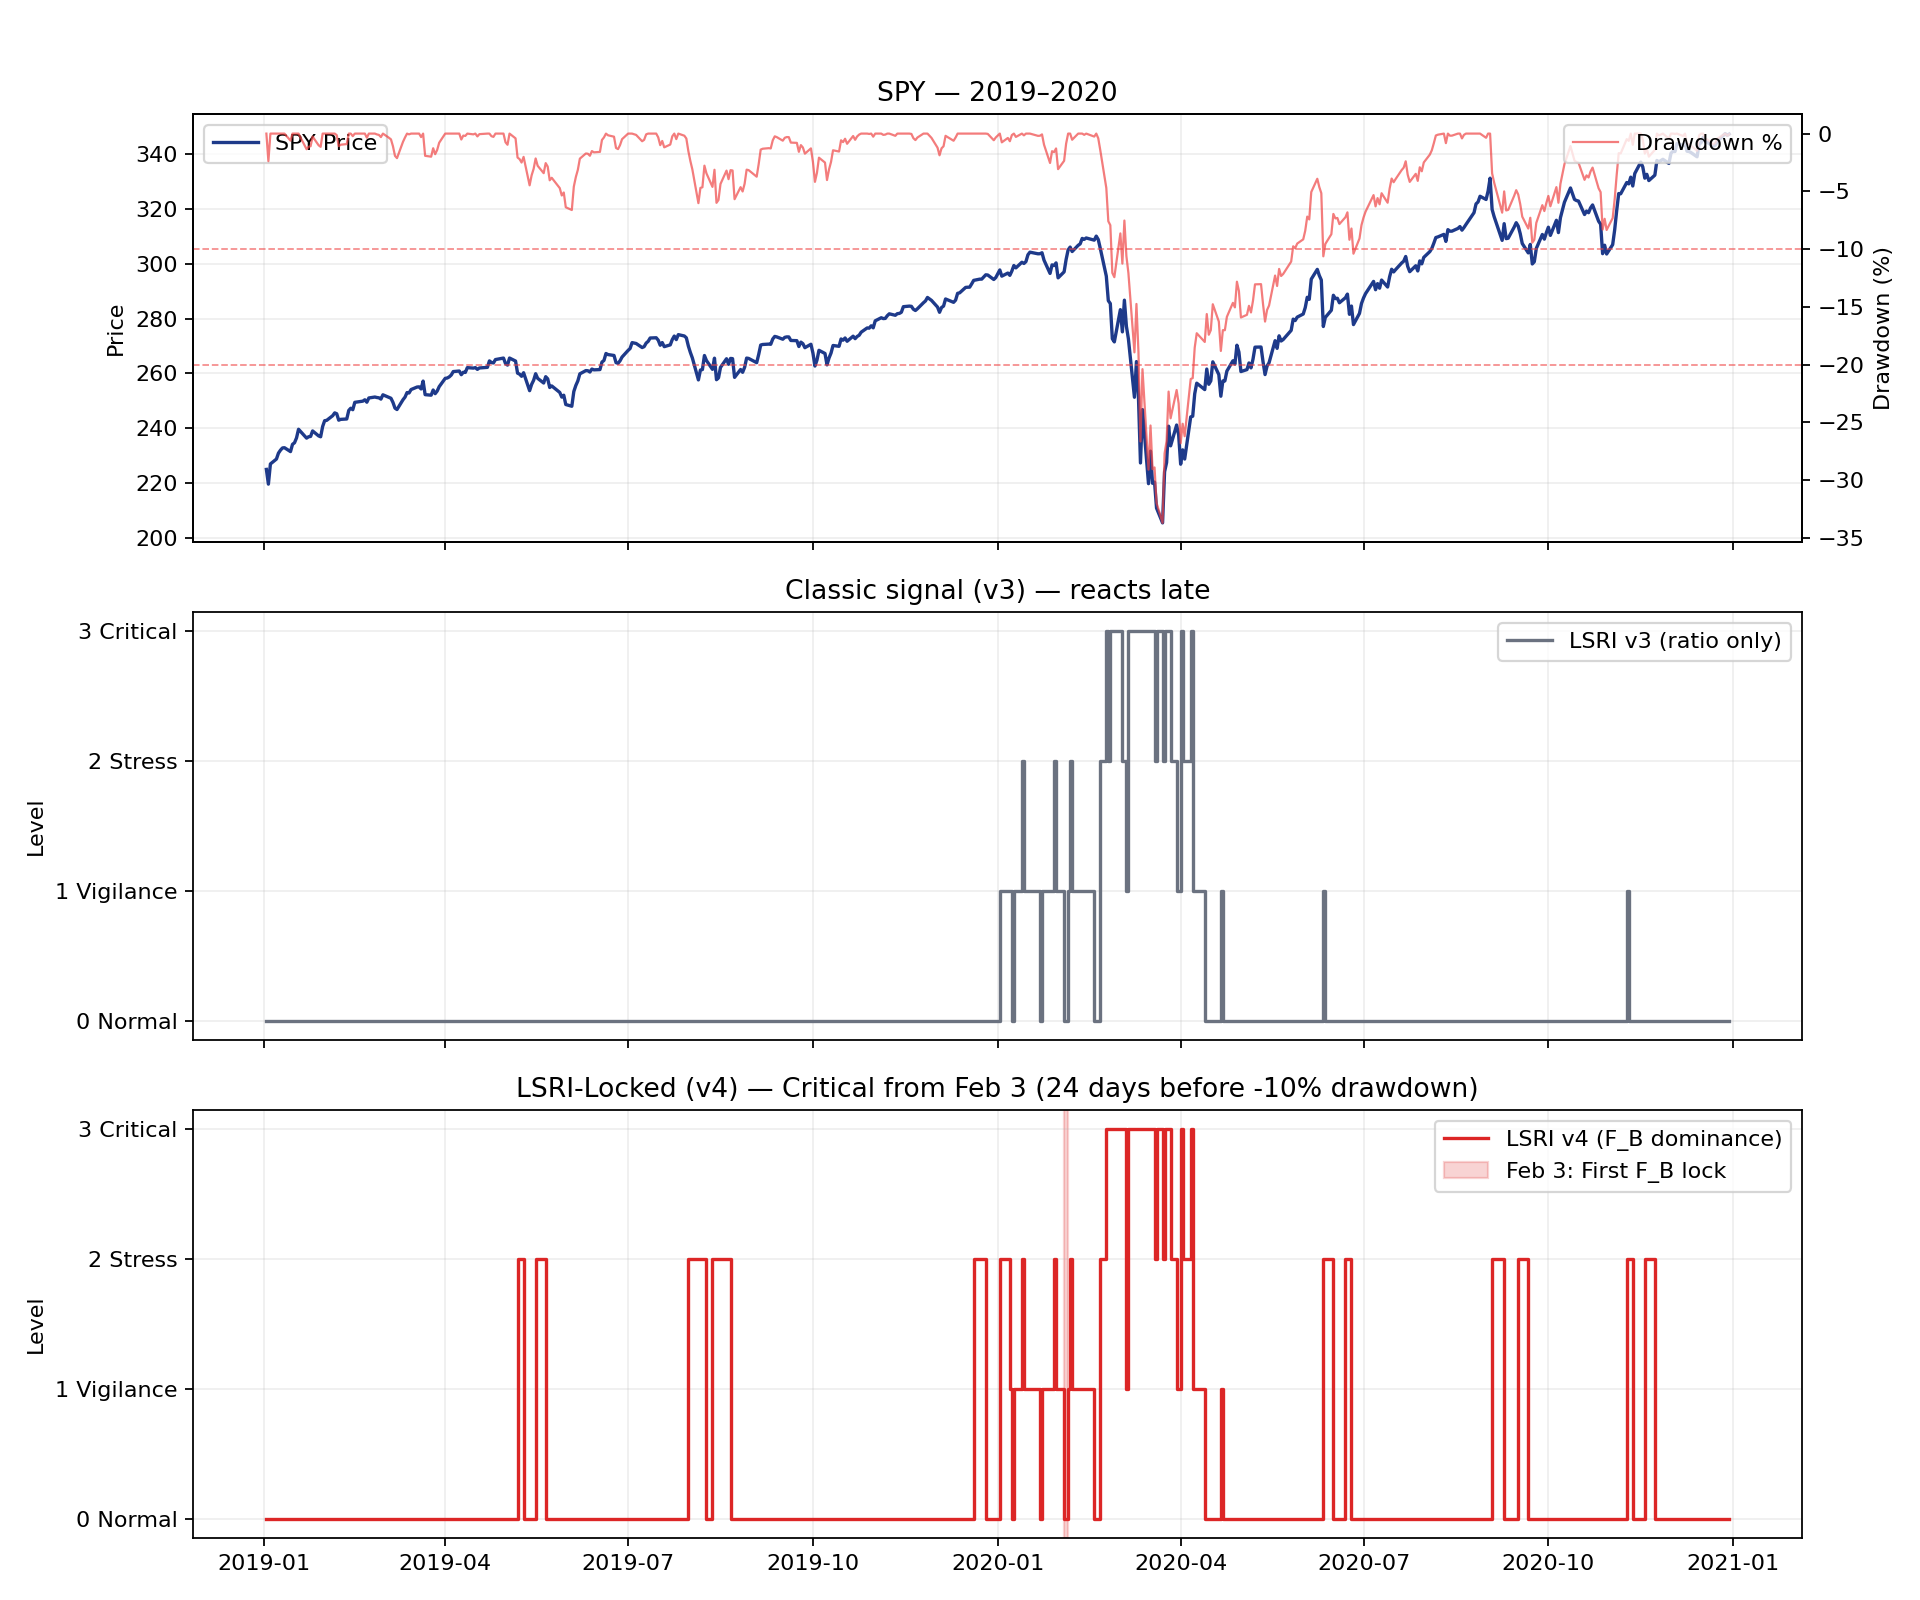
Price + drawdown (top) | Classic v3 signal — reacts late (middle) | LSRI-Locked v4 — Critical from Feb 3 (bottom)
Why it's the mathematical "coup de grâce"
Once structural dominance is established, the point of no return is mathematically excluded. In finance, once $F_B$ detected this lock on February 3rd, the "return to normal" was already excluded by the structure of flows — even though the price took 3 weeks to reflect it.
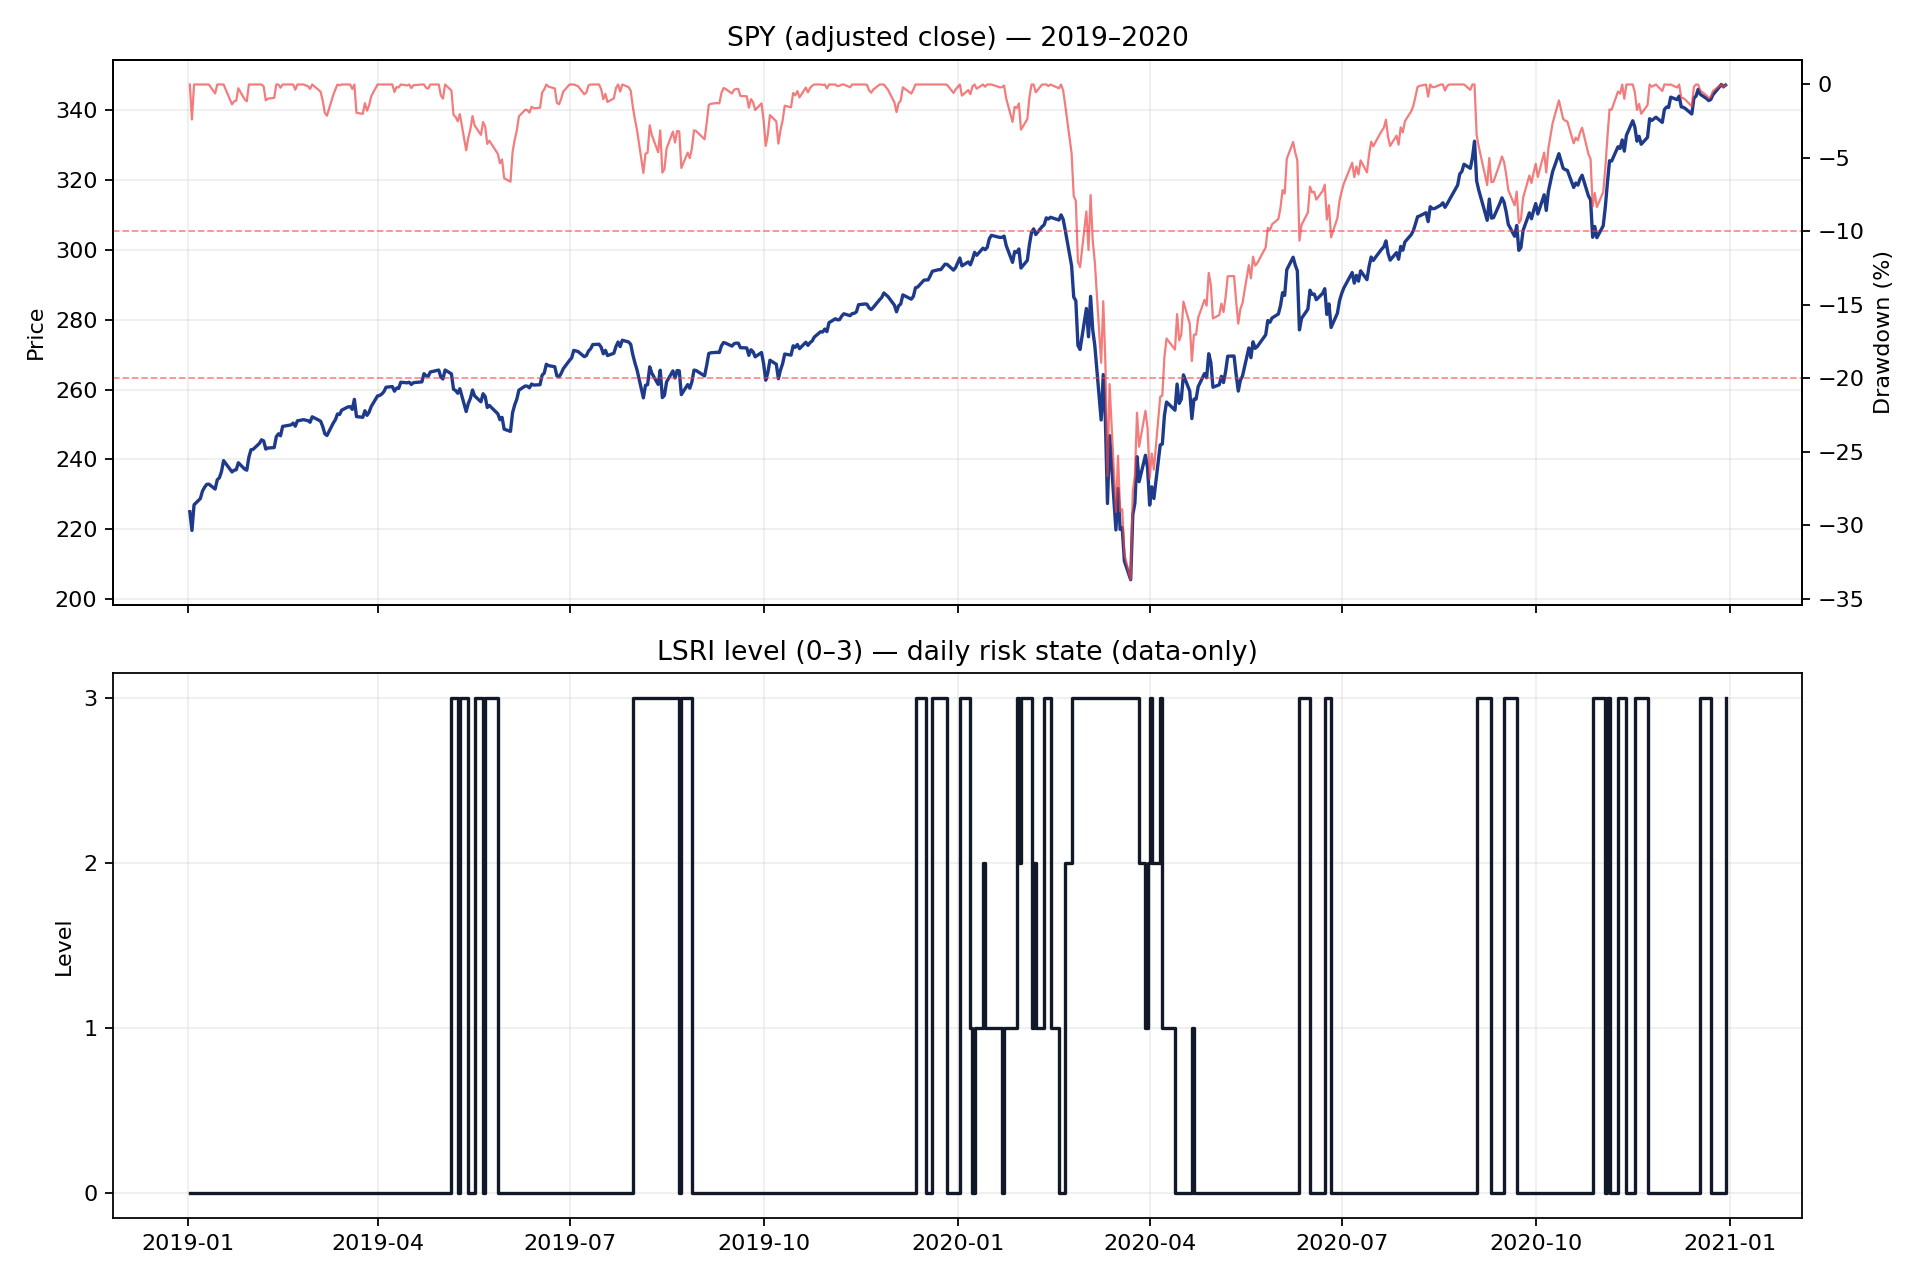
Standard LSRI view
This graph illustrates LSRI's observed classification during the March 2020 period.
- The Structural Advantage — v4 (F_B) detected structural lock on Feb 3, 24 days before -10% drawdown; v3 (ratio only) stayed at Level 1
- Regime transition — LSRI moved into a stress regime (level ≥2) before the most severe phase of the drawdown
- Sustained stress — The risk state remained elevated for multiple consecutive days
- Early detection — Structural stress was identified before volatility spiked
- Documentation — Each data point is timestamped and versioned for audit purposes
Methodology
Reproducibility
This case study is fully reproducible. The graph above was generated from the same methodology used in production: rolling Z-score (252-day window), burn-in period for reliable signals, no look-ahead bias.
How to reproduce locally:
python scripts/case_study_2020_spy.py
The script downloads SPY data (yfinance), computes LSRI over 2019–2020, and outputs case_study_2020_spy.csv, case_study_2020_spy.png, and case_study_2020_spy_structural_advantage.png. Full instructions: CASE_STUDY_2020_SPY.md
Governance
Key takeaways for committees
Documentation matters more than prediction in committee settings.
- "When did structural stress begin, and how long did it persist?"
- "Were positions held during a documented regime transition?"
- "What evidence exists for risk committee decision-making?"
- "How does this complement traditional volatility metrics?"
Daily monitoring
Review LSRI levels alongside portfolio positions each trading day.
Committee reporting
Include regime state in risk dashboards and weekly reports.
Audit trail
Timestamped data points for governance documentation.
Early warning
Structural stress detection before volatility spikes.
Proven across three crises
LSRI V4 has been validated on Flash Crash 2010, Bear Market 2022, and the Dec 2018 rebound. See Proven Reliability →
LSRI provides market state data and does not provide trading signals, forecasts, or investment advice. Data is provided "as is" without warranty.